Below the Floor
Two hundred and eighty launches, and the bus waiting through all of them.
A 0.6B model in bf16. 1.19 GB of weights, on a card whose streaming bandwidth measures 380 GB/s. Every number small enough to hold in your head, which is the only reason to use a model this size.
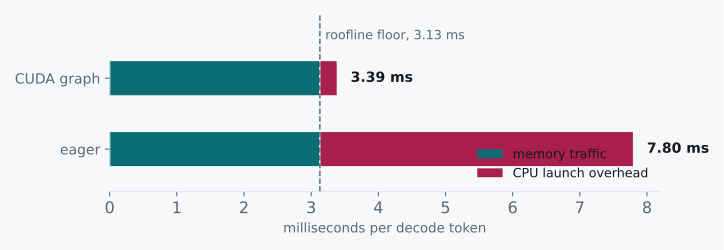
roofline floor  =  1.19 GB ÷ 380 GB/s  =  3.13 ms/token
measured        =                         7.80 ms/token
Two and a half times the floor.
That floor is chapter 7's promise, presented for payment. If decoding is memory-bound, then the time to make a token should be the time it takes to drag the weights across the bus. Nothing more. Nothing else is on the critical path. Promises like that are checkable, and I think you should check them, especially the ones you like.
Check the promises you like best. They are the ones nobody else is going to check for you.
The card is achieving 153 GB/s out of the 380 it demonstrably has, which is forty percent of a bus chapter 7 said should be saturated. Somewhere inside every single token, four and a half milliseconds are going somewhere that is not the memory bus, on a workload we have spent two chapters calling memory-bound.
11.1 Candidates and the Ratio
There are two ways to explain a measurement that misses its floor, and they point in opposite directions: either the floor is wrong, or our account of where the time goes is incomplete.
The first: the 380 GB/s figure is a streaming-copy number, and the weight reads in a real forward pass have an access pattern that cannot reach it. Real achievable bandwidth here is nearer 153 GB/s, and the floor was wrong from the start.
The second: the bus really does deliver 380 GB/s, and the extra 4.67 ms is time when nothing is being read at all.
Chapter 1 handed us the tool for exactly this shape of question, and it is worth going back for it. The floor test says a measurement that beats a theoretical floor means the work did not happen.
This is that same rule, looked at from the other end. A measurement that misses a floor by 2.5× means work happened that we were not counting. Either the floor is wrong, or our picture of what the machine is doing has somebody missing from it. Those are our two candidates, and the arithmetic can tell them apart without us guessing.
11.2 The Axioms
To tell those apart we need to know what the machine is made of, and in particular we need one number that neither of the previous two chapters ever asked for. The first four rows below are about the model and the card. The fifth is about something else entirely:
| Quantity | Value |
|---|---|
| Model weights, 0.6B bf16 | 1.19 GB |
| Measured streaming bandwidth | 380 GB/s |
| Transformer layers | 28 |
| GPU operations per layer (attention, MLP, norms) | ~10 |
| CPU cost to dispatch one operation, eager PyTorch | 5–20 µs |
That last row is the one chapters 7 and 8 never mentioned, and notice that it is not a GPU number at all.
Every kernel that runs on that card was put there by the host. A Python call, a dispatch through the framework, a driver call that enqueues work on a stream. The GPU does not read its own program and decide what to do next. Something on the CPU has to hand it each piece, one at a time, all day long.
11.3 Doing the Division
So let's count the handoffs in one token.
operations per token  =  28 layers × ~10 ops  =  ~280 launches

unaccounted time      =  7.80 ms − 3.13 ms    =  4.67 ms
per launch            =  4.67 ms ÷ 280        =  ~17 µs
Two hundred and eighty times per token, a CPU says go, and a GPU that could have started already waits to be told.
Seventeen microseconds per operation, which sits comfortably inside the 5 to 20 µs the axiom table gives for eager dispatch.
The gap is not some mystery quantity we have to attribute on faith. It is 280 individual acts of a CPU telling a GPU what to do next, each one costing about what a Python-dispatched kernel launch costs, and together they account for the missing time almost exactly.
The bus is not slow. The bus is bored.
So the first candidate goes. The bus is not slow. The bus is idle, waiting for a CPU that is 280 function calls behind. Each kernel, once launched, runs at full bandwidth. The problem was never inside any of them. The problem is the gaps between them.
11.4 What This Rules Out
This rules out an entire category of fix, and it is the category everybody reaches for first.
Every kernel in that forward pass could be made twice as fast and the token would still carry 4.67 ms of CPU time, because the CPU work happens between the kernels, not inside them. Optimizing a kernel that is already bandwidth-saturated, in a step where sixty percent of the wall clock is dispatch, is a week spent on the other forty.
It also rules out more bandwidth. A card at 760 GB/s halves the 3.13 ms and leaves the 4.67 alone, taking 7.80 down to 6.23. You would have doubled the most expensive component in the machine for a twenty percent improvement, and the profiler would still show a bus at forty percent utilization, except now it would be at twenty.
What survives is an observation about repetition. That sequence of 280 launches is the same every single token. Same kernels. Same order. Same shapes. Same buffers. We are paying a CPU to make an identical set of decisions several hundred times a second, and it makes them correctly every time, and none of them were ever in doubt.
That is a recording problem.
Several hundred times a second, a computer carefully re-derives a conclusion it has never once got wrong.
CUDA graphs let us capture the whole launch sequence once and replay it as a single submission. The host makes one call instead of 280, and the GPU walks the recorded graph itself. The arithmetic does not change at all. The 3.13 ms of memory traffic is still there, still irreducible, still the floor. What goes away is the waiting.
11.5 The Pictorial
One token, drawn as a timeline of who is doing the work:
  eager, 7.80 ms
  CPU   ##  ##  ##  ##  ##  ##  ##  ##  ##  ##  ...  280 dispatches
  GPU     ##  ##  ##  ##  ##  ##  ##  ##  ##  ##
        ^^  ^^  ^^  ^^   bus idle in every gap

  graphed, ~3.4 ms
  CPU   #                                          one replay call
  GPU    ##############################            same kernels, no gaps
The GPU work is identical in both pictures. The only thing we deleted was waiting for permission.
One division, and we never once had to open a kernel. I have had entire weeks go worse than that.
And notice what we did not have to understand to get here. We never opened a kernel. We never looked at an access pattern. We never learned what the attention implementation does with its tiles, and I could not tell you offhand. We computed a floor, found a gap, divided the gap by a count, and the answer named itself.
Challenges
-
The gap arithmetic assumed ~10 GPU operations per transformer layer. Look up or count the actual operations in one layer of a model you have handy, redo the per-launch division, and say whether 17 µs still looks like dispatch or whether something else is hiding in there.
-
CUDA graphs need static shapes, so a server captures one graph per batch size and pads up. Work out the cost of that padding at batch 5 on a system with graphs at 1, 2, 4, 8, and say when the padding waste would exceed the launch overhead it saves.
-
This chapter's model was 0.6B. Redo the floor and the gap for a 7B model on the same card, and say whether launch overhead is a larger or smaller fraction of the token. Then say what that implies about which deployments care most about this fix.
-
Graph replay reuses the same input and output buffers every time. Describe the bug that produces, in a server handling concurrent requests, if the output buffer is handed to the caller directly. Then describe how you would detect it in production, given that it produces plausible text rather than a crash.
Design Note: The Floor Test Runs in Both Directions
Chapter 1 introduced the floor test as a fraud detector. Compute the fastest the work could possibly go. Measure faster than that. Now you know something you believed was happening did not happen, and a 4 KB write that returns in 200 nanoseconds never reached the disk.
This chapter is the same instrument held upside down, and I have come to think it is the more useful orientation.
Compute the floor, measure well above it, and you have found work you were not modelling. Not a slow component. An unmodelled one. That distinction matters enormously, because it redirects the entire search. A slow component means go profile it and optimize it. An unmodelled component means your picture of the machine is missing a participant, and no amount of profiling the parts you already know about will introduce you to somebody you did not know was in the room.
Both directions share one requirement, and it is the same requirement as chapter 1's design note. You have to compute the floor before you measure. A floor derived afterwards has an unfortunate habit of landing suspiciously close to whatever you happened to observe, and you will never catch yourself doing it. Write down bytes ÷ bandwidth first. Then run the thing. Then let the gap be as embarrassing as it wants to be.