The Cache That Ate the Batch
512 KB per token, and why the field went where it went.
Put a 7B model on an 80 GB card and ask it to run 156 sequences at once.
It dies at 64.
Not 156. Sixty-four. Less than half, and it is not close. We did not tune a knob and miss by ten percent. The process died with an out-of-memory error, two and a half times short of the target.
That target was chapter 7's parting instruction, and it felt like a victory at the time. Batch 156 sequences together and we reach the A100's ridge point: the GPU stops idling, compute finally becomes the limit, everybody goes home happy. So we tried it, on the same model and the same card, and the card declined.
Sixty-four is not a tuning failure. It is an arithmetic result that nobody had got around to computing.
Something is spending memory that chapter 7 assumed was free.
8.1 Two Candidates and a Missing Number
Something is eating the difference, and there are two obvious suspects. One of them is a scheduling problem we could fix by being cleverer. The other is a cost we simply never counted.
The first: this is a scheduling problem. We are padding variable-length sequences to a common size, and the padding is eating the capacity.
The second: it is not padding at all. There is a second, growing memory cost that chapter 7 never priced.
Before we go hunting for padding bugs, it is worth checking the ratio. And the fastest way in is to ask what chapter 7 actually accounted for.
It accounted for exactly one thing living on that GPU: 14 GB of weights. It said nothing whatsoever about what accumulates during generation.
Now think about what has to accumulate. Every token already produced leaves behind a cached Key and Value tensor, kept around so the next token does not have to recompute attention over the entire prefix from scratch. That cache has a size. And it was completely absent from last chapter's arithmetic, not because anybody was careless, but because at batch size one, generating one token, there was nothing yet to accumulate.
8.2 The Axioms
For a 7B-class model (32 layers, 4096-dim hidden state, fp16):
| Quantity | Value |
|---|---|
| KV cache per token | 2 × 32 layers × 4096 dim × 2 bytes = 512 KB |
| KV cache per 2048-token sequence | 512 KB × 2048 = 1 GB |
| A100 total memory | 80 GB |
| Model weights (fp16, 7B) | 14 GB |
The factor of 2 is Key and Value: one tensor each, per layer, per token.
That is not an implementation detail you can shrink by being clever with your batching loop. I want to be firm about it, because it is the first thing people reach for. It is a per-token cost that accrues for as long as that token stays in context, for every sequence running concurrently, and no amount of scheduling makes it smaller.
A 2048-token conversation costs a gigabyte. The complete works of Shakespeare are about five megabytes.
Half a megabyte. Per word. Per conversation.
If you are used to thinking of a model as its weights, that is the number that will catch you out, and it caught me out too. The weights are the part that has a name and a download size. The cache is the part that decides how many people you can serve.
8.3 Doing the Division
With a number for what a token costs, the batch ceiling is one subtraction and one division. Take the card, remove the weights, and see how many one-gigabyte sequences fit in what is left:
memory budget for KV cache = 80 GB − 14 GB (weights) = 66 GB
sequences that fit          = 66 GB ÷ 1 GB/sequence  ≈ 66
Sixty-six. Before we account for activation memory, the CUDA context, and the other fixed overhead that eats a couple more gigabytes off the top, which is exactly how we land at the observed 64.
Somewhere there is a very tidy padding fix, thoroughly reviewed and merged with compliments, that bought absolutely nobody anything.
The KV cache arithmetic alone explains the shortfall. All of it. There is nothing left over for padding to be responsible for, and if we had gone hunting for padding bugs we would have found some, fixed them carefully, and moved the number by almost nothing.
8.4 What This Rules Out
This rules out the idea that chapter 7's ridge is reachable just by batching harder.
The ridge told us the compute-optimal batch size. This chapter shows the memory-optimal batch size is a harder ceiling sitting underneath it. We hit the KV wall at 64 before we got anywhere near the 156 the ridge wanted, and no amount of scheduling cleverness moves that. It is set by architecture and context length, and that is the end of it.
It also reframes what "add more GPU memory" actually buys. Linear headroom, at GPU prices, for a problem that feels quadratic from the inside. Every additional sequence costs another gigabyte for the whole time it is in flight, not once.
A gigabyte per conversation, for as long as the conversation lasts. Thinking out loud turns out to be an expensive habit.
So the field's answer was not bigger GPUs. It was making the 512 KB number itself smaller. And if you have ever wondered why half the acronyms in this corner of the field exist, this is where they come from: every one of them is an attack on that constant. Three moves, and you will meet all three.
- Multi- and Grouped-Query Attention (MQA/GQA): share Key and Value projections across several attention heads instead of computing a distinct KV pair for each. Divides the 512 KB directly by the sharing factor.
- KV cache quantization: store K and V in int8 or lower instead of fp16. The same lever as quantizing weights in chapter 7's challenge 3, pointed at the cache instead.
- PagedAttention: stop pre-allocating each sequence's cache for its worst-case length. Hand out fixed-size pages on demand, like virtual memory, so unused headroom in a short sequence is not locked away from a longer one running beside it.
Half the acronyms in this corner of the field are attacks on one constant. Once you know which constant, the reading list gets much shorter.
Every one of those attacks the 512 KB constant, or the waste around it. None of them touch the ridge point from chapter 7. Different wall, different tool, and that distinction is the whole reason these are two chapters instead of one.
8.5 The Pictorial
Two bars, one card. The top one is what we can actually run. The bottom one is what chapter 7 told us to run, drawn to the same scale so you can see exactly how far past the edge of the card it goes:
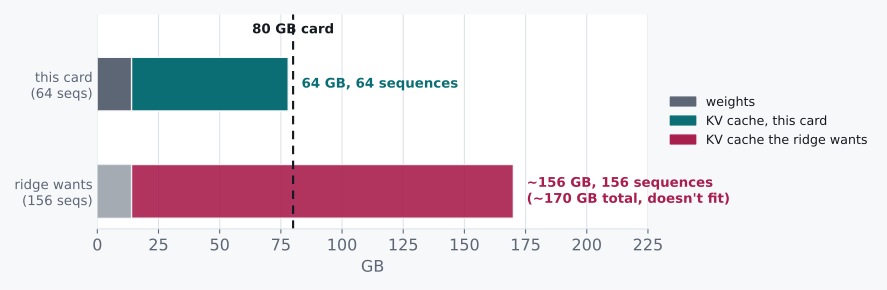
(Activation memory and other fixed overhead, a couple more gigabytes, are not shown. They are what pushes the real ceiling from 66 down to the observed 64.)
experiments-gpu/08_kv_cache.py allocates a
real KV cache and asks CUDA what it cost, instead of trusting the 512 KB
multiplication, and measures the exact factor GQA saves. A free Colab T4 is
enough. See Experiments.
Challenges
-
Grouped-Query Attention with a group size of 8 divides the KV cache per token by roughly 8. Recompute the batch ceiling on the same 80 GB card, and check it against the ridge point's target of ~156.
-
Sequences in a real batch don't all sit at 2048 tokens: some are 200 tokens long, some are 4000. Design a memory-accounting scheme for the 66 GB budget that handles this without falling back to "pad everyone to the max length." (This isn't fully answerable from this chapter alone; you'll need to think through what PagedAttention is actually doing under the hood.)
-
int8 KV quantization halves the 512 KB/token figure. Does it change the ridge point from chapter 7, or only the batch ceiling from this chapter? Be precise about which number moves and which doesn't.
-
A 70B model has roughly 10× the weights of the 7B one, but its KV cache per token doesn't scale by the same factor unless hidden dimension and layer count both scale linearly with parameters. Look up (or estimate from architecture) whether a real 70B-class model's KV-cache-per-token is closer to 5× or 10× the 7B figure, and redo the 80 GB budget.
Design Note: Two Walls Look Identical From the Outside
"Generation is slow" and "batch size is capped" arrive as the same complaint. Throughput is not what it should be. Somebody is unhappy.
Chapters 7 and 8 are proof that the identical complaint can have completely unrelated causes. One is a compute-versus-bandwidth ratio on the chip. The other is a bytes-versus-capacity ratio in memory. Neither diagnosis transfers to the other's fix, and neither one is visible from the complaint.
Buy a GPU with more TFLOPS and you have solved the wrong wall if you are capped by KV memory. Buy one with more memory and you have solved the wrong wall if you are capped by the ridge. Both purchases feel responsible. Both come with a graph. The only way to know which one you are actually against is to do both pieces of arithmetic, FLOP per byte against the ridge and bytes per token against the budget, before anybody spends money on either.
That is more or less the whole book in a sentence: two numbers that do not fit are two different chapters, and they very rarely share a fix.