The Ridge
Arithmetic intensity, and the 99% idle GPU.

I want to show you a machine that costs thirty thousand dollars and spends nearly all of its life doing nothing at all.
It is an A100, and it can perform three hundred and twelve trillion arithmetic operations every second. We hand it a 7-billion-parameter model and ask for a single word. It computes for forty-five microseconds. Then it waits for seven milliseconds.
Thirty thousand dollars of silicon, idle 99.4% of the time. Even a landlord would be embarrassed.
Do the fraction. The thing is busy six-tenths of one percent of the time.
Now, when you first see a number like that, the natural thing to think is that somebody made a mistake. Sloppy code, a bad driver, an engineer who did not know what they were doing. I thought exactly that, the first time I saw it. It is the comfortable explanation, because it means somebody can go and fix it.
It is not a mistake. And what I want to show you is how you can prove that with arithmetic you can do on a napkin, and how, once you see why the machine is idle, you also see precisely what to do about it.
7.1 Two Candidates and a Missing Number
There are only two possibilities worth taking seriously here.
Either producing a word takes an enormous amount of arithmetic and the chip is straining to keep up. Or it takes hardly any arithmetic at all, and the chip is sitting there waiting on something that has nothing to do with arithmetic.
Those call for opposite remedies, so before anybody argues about which it is, let's just count. Generating one token from a 7B model, batch size one, costs roughly:
compute:  2 × 7×10⁹ params  ≈  14 GFLOP
memory:   7×10⁹ params × 2 bytes (fp16)  =  14 GB  read
Fourteen billion operations. Fourteen billion bytes.
One operation per byte moved.
One operation per byte. The most powerful chip in the building, being used as a very expensive way to read memory.
That ratio has a name, arithmetic intensity, and it is the only number this chapter needs in order to compute everything else.
7.2 The Axioms
One FLOP per byte is a fact about our workload. To know whether that is a lot or a little, we need the matching fact about the hardware, and that one we have to be handed. Two numbers off a spec sheet, and one ratio between them:
| Quantity | A100 (SXM, fp16) |
|---|---|
| Peak compute | ~312 TFLOP/s |
| Peak memory bandwidth | ~2 TB/s |
| Ridge point (compute ÷ bandwidth) | ~156 FLOP/byte |
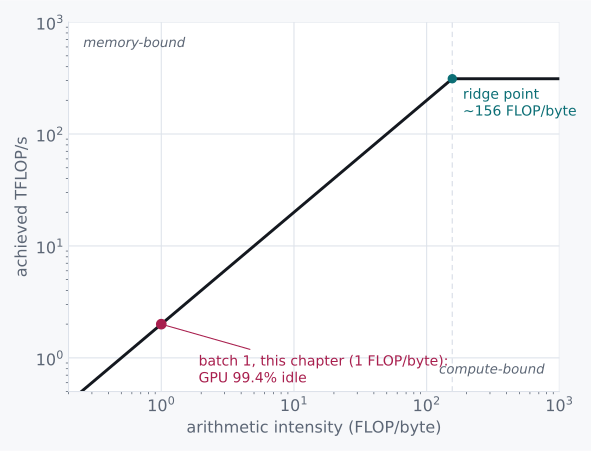
The ridge point is where a workload stops being memory-bound and starts being compute-bound, on this specific piece of silicon.
Below it, the chip finishes its math faster than it can be fed, and sits idle waiting on the memory bus. Above it, the bus delivers data faster than the chip can chew through it, and the arithmetic units become the limit. It is a property of the hardware and nothing else. It does not know what you are running.
7.3 Doing the Division
Our workload sits at 1 FLOP/byte. The hardware's ridge is around 156. Let's line them up.
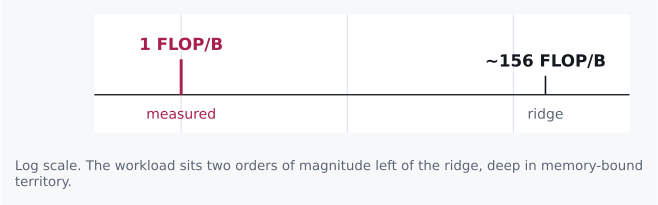
Now convert both halves into time, using the axioms:
compute time:  14 GFLOP ÷ 312 TFLOP/s  ≈  45 µs
memory time:   14 GB ÷ 2 TB/s          ≈  7 ms
Memory time is about 156× longer than compute time.
That is not a coincidence, and it is worth pausing on. That ratio is the ridge point, restated in seconds instead of FLOP per byte. The same number, wearing different units, arrived at from a completely different direction. When that happens you are usually onto something real.
The chip finishes its 14 GFLOP in 45 microseconds and then waits 6.95 milliseconds for the next byte of weight to show up.
7.4 What This Rules Out
This rules out the instinct to fix slow generation by buying a higher-TFLOPS card.
If your bottleneck sits 156× to the left of the ridge, tripling peak compute moves the ridge point further right and helps you not at all. You were never anywhere near the compute wall. You would be buying more of the thing you already have too much of, which is a wonderfully expensive way to change nothing.
There is always a bigger card, and it always comes with a graph showing how much bigger it is.
What would move the needle is more memory bandwidth. Or, and this is cheaper and much more interesting, changing the workload's arithmetic intensity itself.
Which is what this chapter has been building toward. At batch size one, we read the entire 14 GB of weights to compute one token's worth of math. At batch size 32, we read the same 14 GB once and compute thirty-two tokens' worth of math against it before the next byte has to arrive. The memory cost did not grow with batch size. The compute did.
It is worth doing that division in symbols, because the answer comes out cleaner than it has any right to. Call the parameter count N. Each weight is two bytes in fp16, and each weight takes part in exactly one multiply-and-add, which is two operations. At batch size B:
bytes moved  =  2 bytes/weight × N              =  2N
operations   =  2 ops/weight × N × B sequences  =  2NB

                 2NB
intensity  =  --------  =  B FLOP/byte
                  2N
The twos cancel. The parameter count cancels. What is left is the batch size itself.
When everything cancels and one variable is left standing, sit up. Nature is rarely that accommodating twice in a chapter.
Arithmetic intensity, for this workload, is B. Not approximately. Not in the limit. At batch 32 we sit at exactly 32 FLOP/byte, still under the ridge but far closer to it, and throughput scales almost for free on the way there.
That identity is the thing to carry out of this chapter. It turns the ridge point from a property of the silicon into a number you can type into a config file. A ridge of 156 FLOP/byte says, in plain language, run about 156 sequences at once. Every serving system in the world exposes that number as a tunable, and now you know what it is tuning against.
7.5 The Pictorial
Every serving framework has this knob. Most of the people turning it are doing so by feel, which is a shame, because it is just a division.
All of this fits on one chart, and it is worth learning to read because you will meet it again for the rest of your career. Arithmetic intensity runs along the bottom. The diagonal is what memory can feed you; the flat top is what the chip can compute. Where they meet is the ridge, and everything to the left of it is waiting:
experiments-gpu/07_roofline.py measures
your own card's ridge point rather than quoting the A100's, then walks a batch
size toward it. A free Colab T4 is enough. Predict your ridge, and the percent
of peak you will get at batch 1, before you look. See
Experiments.
Challenges
-
Batch size 32 gets you to ~32 FLOP/byte, still left of the ridge. What batch size would this workload need to actually reach ~156 FLOP/byte, and what has to be true about your traffic for that batch to fill up without unacceptable latency?
-
A 13B model has roughly double the weight bytes and double the FLOPs per token of the 7B one. Does its ridge crossing point (in batch size) change, stay the same, or move, and in which direction?
-
Quantizing weights from fp16 to int8 halves the bytes read per token without changing the FLOP count much. Recompute arithmetic intensity at batch 1 under int8, and say whether this workload is any closer to the ridge.
-
Prefill (processing a whole prompt at once) replaces the matrix-vector multiply this chapter used with a matrix-matrix multiply, because many tokens' worth of activations move through the weights together instead of one at a time. Redo the 7.1 arithmetic for a 2048-token prefill pass: does the FLOP count grow with prompt length, does the byte count, and where does arithmetic intensity land relative to the ridge? (Nothing above answers this; you'll need to derive the matrix-matmul FLOP count yourself.)
Design Note: The Ridge Doesn't Care How You Feel About the GPU
"99.4% idle" reads like a scandal the first time you compute it, and the natural response is to go looking for somebody to blame. Bad kernels. An unoptimized runtime. A driver issue. Somebody upstream who did not care enough.
Usually none of that is true. The chip is idle because the arithmetic says it should be idle, and no amount of engineering effort inside a single forward pass, at batch size one, changes which side of the ridge you are standing on. You can rewrite that kernel with enormous skill and win nothing, and the failure will feel like your fault, and it will not be.
The lesson generalizes past GPUs. Any time you are tempted to profile harder to explain a bottleneck, check arithmetic intensity against the hardware's ridge point first. If you are two orders of magnitude to the left of it, the profiler is going to show you a chip waiting on memory no matter how you slice the flame graph, and the fix was never going to live inside the kernel you were about to spend a week on.